Download Raster Image Files
Download Landsat 8 bands QA (Quality Assurance), 5 (Near Infrared), and 7 (Shortwave Infrared 2) .tif files for area of interest from USGS EarthExplorer (see band details). For this project, I use path/row combinations 175026, 175027, 176025, 176026, and 176027. For each area, I select one low-cloud-cover image from Summer 2014 and one low-cloud-cover image from Summer 2021.
File names will be of the form LC08_L2SP_174025_20140808_20200911_02_T1_QA_PIXEL.tif, etc., where 174025 denotes the path (174) and row (025), and 20140808 is the date of the satellite pass (08/08/2014).
Calculate Normalized Burn Ratios
Set up:
import arcpy
from arcpy import env
from arcpy.sa import *
arcpy.env.workspace = "./data"
arcpy.env.overwriteOutput = True
Raster data management:
# Build lists of raster filenames containing selected strings
rasters_qa = arcpy.ListRasters(
    "*_QA_PIXEL*",
    "TIF"
    )
rasters_b5 = arcpy.ListRasters(
    "*_SR_B5*",
    "TIF"
    )
rasters_b7 = arcpy.ListRasters(
    "*_SR_B7*",
    "TIF"
    )
The formula to calculate Normalized Burn Ratio is:
To eliminate cloud-covered pixels, NBR is multiplied by QA_reclass, where QA is reclassified to QA_reclass = 1 for cloud-free and QA_reclass = 0 otherwise. Therefore, NBR = (b5 - b7) / (b5 + b7) * QA_reclass.
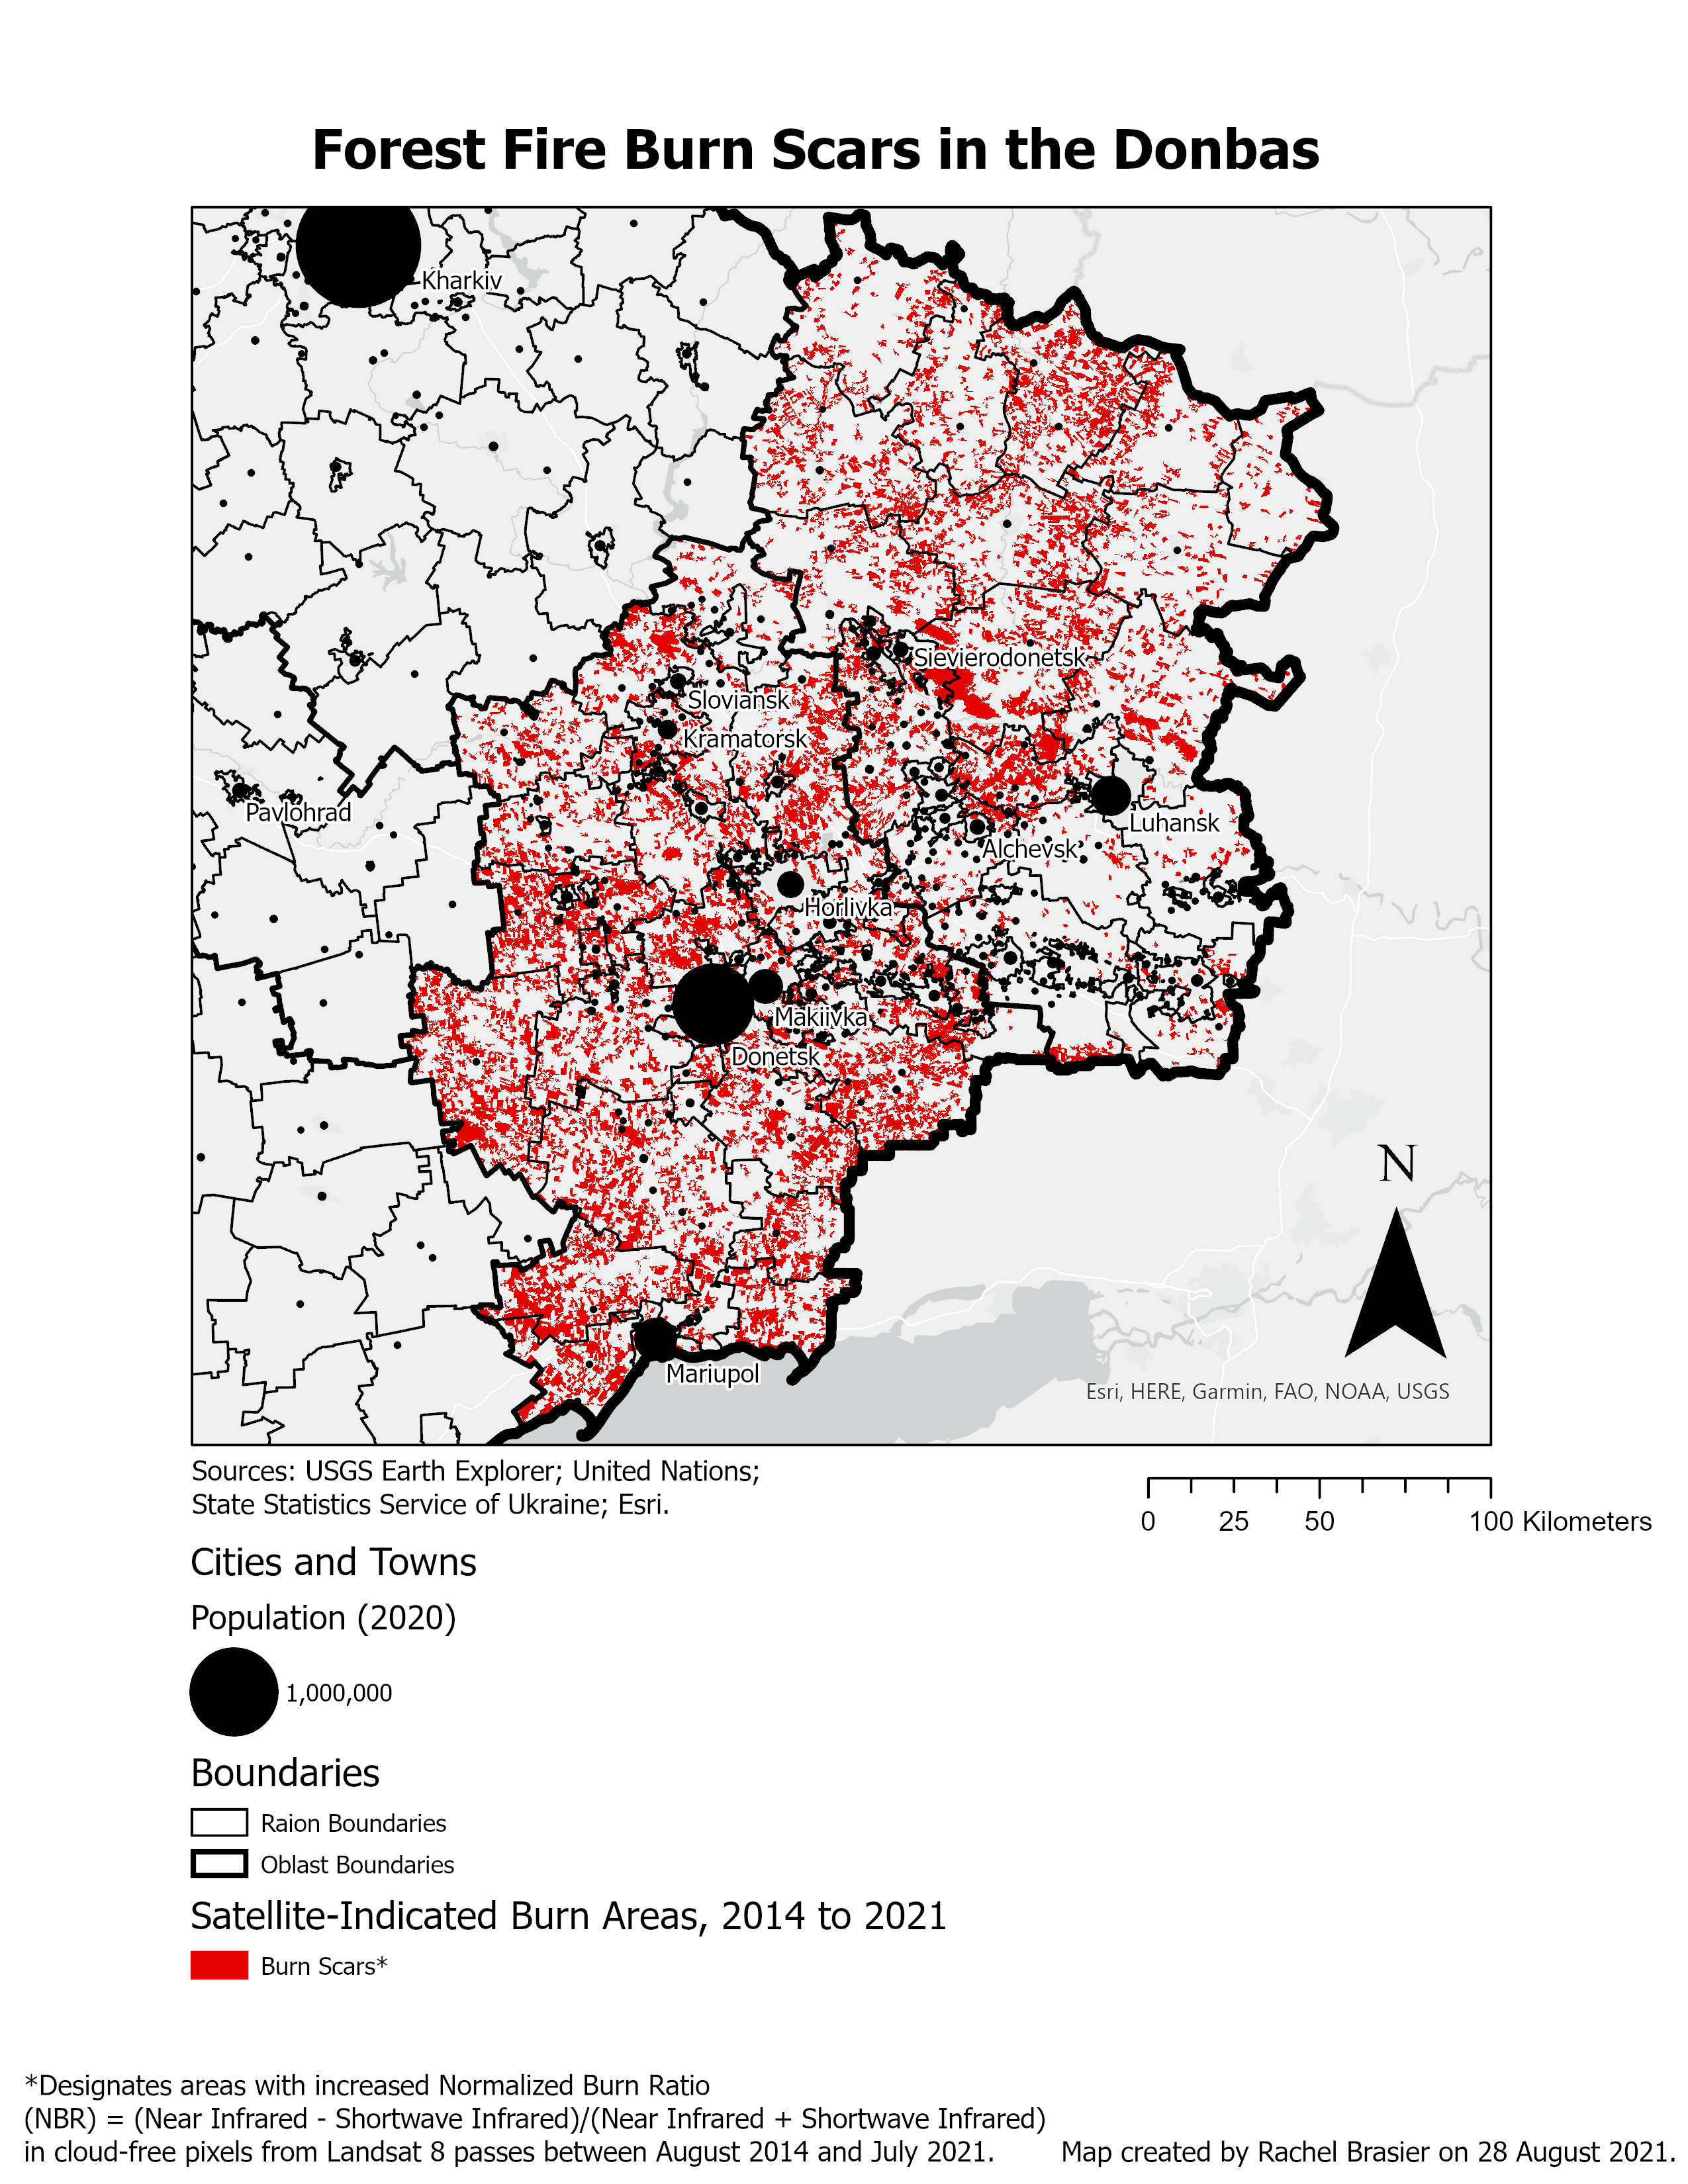
Identify Satellite-Indicated Burn Areas
The NBR rasters are then mosaicked together and the difference (2014 to 2021) computed. This difference is greater than 0 for areas where the burn ratio is higher in 2021 than 2014, indicating newly burned areas.

